The Mt Forrest magnetite iron ore project is operated through
a joint venture. Mindax holds a 65% stake, and Norton Gold Fields Pty Ltd, a
subsidiary of Zijin Mining Group, maintains a 35% stake. This exciting project
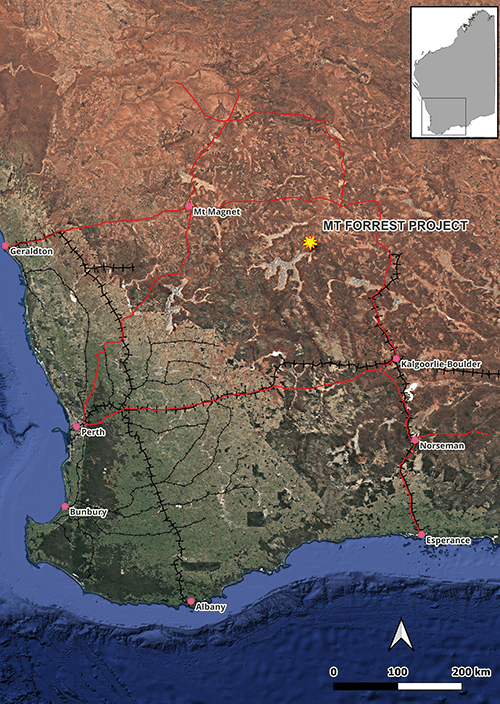
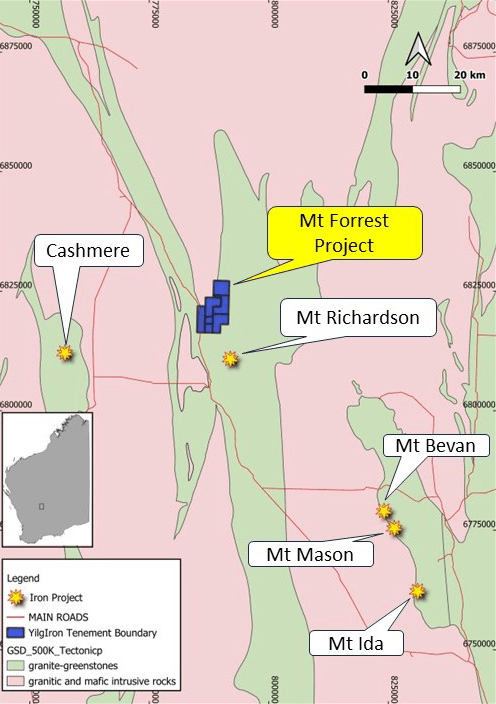
is situated in the Yilgarn province of Western Australia's Mid-West region,
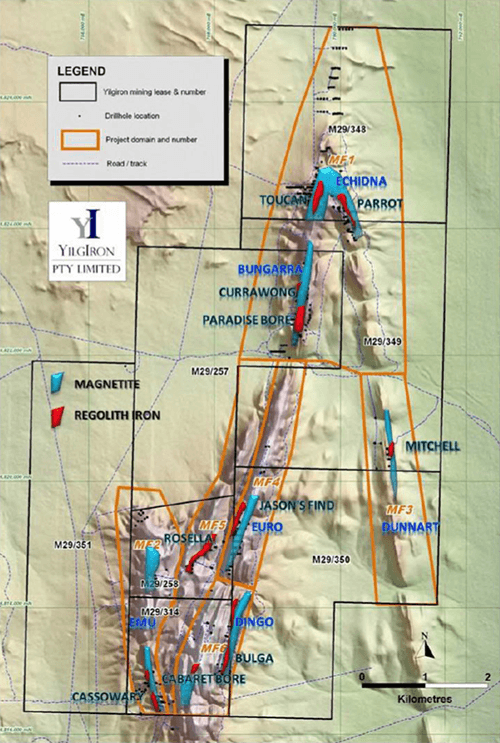
approximately 160 km northwest of Menzies, WA. It encompasses seven mining
leases, covering an area of approximately 53 km2.


The Mt Forrest project boasts a substantial repository of
more than one billion tonnes of magnetite iron ore resources. In a JORC Code
(2012) compliant report released by SRK consulting in February 2023, using a
cut-off grade of 18% mass recovery (MR), the Mt Forrest deposit was estimated
to contain 422.37 Mt of Indicated Resources at average grades of 41.42% MR and
64.76% conFe, and 599.40 Mt of Inferred Resources at average grades of 43.14%
MR and 63.85% conFe.
| Mt Forrest Mineral Resource as of 25 November 2022 (18% MR cut-off grade) |
| Category |
Domain |
Tonnes |
In Situ |
Concentrate |
| |
|
|
HFe |
HSiO2 |
MR |
con |
con |
con |
con |
con |
con |
| |
|
Fe |
SiO2 |
Al2O3 |
P |
S |
LOI |
| |
|
Mt |
% |
% |
% |
% |
% |
% |
% |
% |
% |
| Indicated |
MF1 |
114.54 |
34.48 |
44.05 |
40.04 |
65.01 |
8.49 |
0.16 |
0.02 |
0.11 |
-2.59 |
| MF2 |
240.09 |
33.83 |
46.56 |
42.08 |
65.52 |
8.33 |
0.07 |
0.02 |
0.16 |
-2.63 |
| MF6 |
67.73 |
32.47 |
48.12 |
41.43 |
61.64 |
13.49 |
0.06 |
0.03 |
0.41 |
-2.27 |
| Total |
422.37 |
33.79 |
46.13 |
41.42 |
64.76 |
9.20 |
0.09 |
0.02 |
0.18 |
-2.56 |
| Inferred |
MF1 |
142.75 |
33.75 |
44.97 |
42.01 |
64.83 |
8.95 |
0.15 |
0.02 |
0.10 |
-2.74 |
| MF2 |
250.40 |
34.31 |
45.34 |
44.33 |
64.80 |
9.18 |
0.10 |
0.02 |
0.16 |
-2.65 |
| MF6 |
206.25 |
32.62 |
47.93 |
42.51 |
61.97 |
13.07 |
0.06 |
0.03 |
0.44 |
-2.30 |
| Total |
599.40 |
33.59 |
46.14 |
43.15 |
63.85 |
10.45 |
0.10 |
0.02 |
0.24 |
-2.55 |

The
quality of the final iron concentrate in the Mineral Resource estimates is
sensitive to variations in the cut-off iron grade in concentrate (conFe). A
comprehensive table detailing grade and tonnage under various conFe cut-offs is
presented below.
| Global tonnages and grades at various cut-off conFe grades and above 18% MR |
Cut-off
(conFe %) |
Indicated |
Inferred |
Tonnage
(Mt)
|
MR
(%)
|
conFe
(%) |
conSiO2
(%)
|
Tonnage
(Mt)
|
MR
(%)
|
conFe
(%) |
conSiO2
(%)
|
| 50.00 |
420.19 |
41.47 |
64.84 |
9.11 |
594.41 |
43.30 |
63.96 |
10.34 |
| 52.00 |
414.50 |
41.19 |
65.03 |
8.85 |
590.99 |
43.21 |
64.03 |
10.24 |
| 54.00 |
411.65 |
41.11 |
65.11 |
8.74 |
585.01 |
43.19 |
64.15 |
10.08 |
| 56.00 |
407.61 |
41.05 |
65.21 |
8.60 |
577.28 |
43.11 |
64.28 |
9.91 |
| 58.00 |
398.57 |
40.97 |
65.40 |
8.36 |
554.15 |
43.01 |
64.57 |
9.52 |
| 60.00 |
379.67 |
40.90 |
65.71 |
7.96 |
502.96 |
42.67 |
65.14 |
8.76 |
| 62.00 |
342.88 |
40.87 |
66.21 |
7.32 |
429.30 |
42.73 |
65.83 |
7.86 |
| 64.00 |
281.04 |
40.94 |
66.89 |
6.44 |
316.05 |
42.49 |
66.83 |
6.57 |
| 66.00 |
192.02 |
41.33 |
67.75 |
5.37 |
206.26 |
42.47 |
67.82 |
5.31 |
| 68.00 |
74.51 |
42.78 |
68.89 |
3.99 |
90.45 |
43.25 |
68.88 |
4.00 |
| 70.00 |
6.14 |
43.05 |
70.43 |
2.08 |
7.66 |
43.40 |
70.56 |
1.71 |
It's important to note that these recovered concentrated
grades were estimated using samples ground to a particle size of P97 (97%)
passing through a 75-micron size wet screen during Davis Tube Recovery (DTR)
testing, thereby confirming the high quality, coarse-grained nature of its
resources. For context, typical magnetite iron ore projects conduct DTR tests
at a much finer grind size of 25-35 microns due to limitations in achieving
acceptable concentrate quality at larger grind sizes. A project with excellent
magnetite liberation at 75-micron size would allow for coarser grinding,
resulting in substantial reductions in both capital expenditure and operating
costs.
Notably, there are several prospective areas that have not
yet been drilled. In its report, SRK Consulting cited: “there is great potential
to extend the currently defined Mineral Resources through ongoing exploration.”
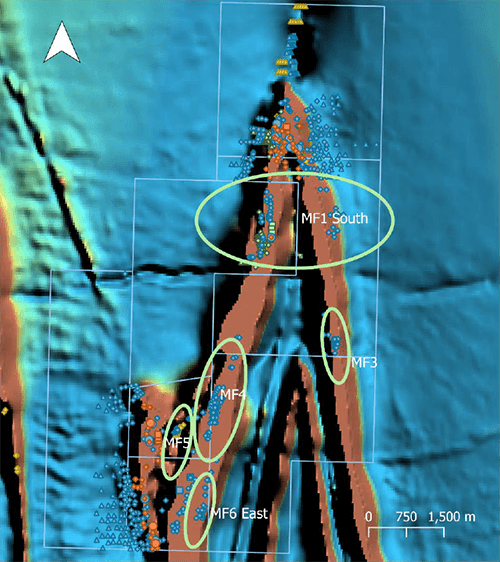
The current resources are not completely closed off both
along the strike and at depth for MF1, MF2 and MF6 deposits. Magnetite mineralisation
has also been identified at the MF3, MF4 and MF5 deposits. The following image has
the major areas circled out which require further exploration based on the
current drill hole data and regional magnetic survey map.
